mirror of
https://github.com/storytold/terraform-aws-observability-accelerator.git
synced 2026-10-09 00:09:43 +00:00
 Rodrigue Koffi
9498a06d3e
Rodrigue Koffi
9498a06d3e
* Update eks.md

Move image assets to upstream repo

* Update index.md

Move assets to upstream

* Update eks-apiserver.md

Move assets to upstream
Fix terminology
58 lines
3.8 KiB
Markdown
58 lines
3.8 KiB
Markdown
# Monitoring ADOT collector health
|
||
|
||
The OpenTelemetry collector produces metrics to monitor the entire pipeline. In the [EKS monitoring module](https://aws-observability.github.io/terraform-aws-observability-accelerator/eks/), we have enabled those metrics by default with the AWS Distro for OpenTelemetry (ADOT) collector. You get a Grafana dashboard named `OpenTelemetry Health Collector`. This dashboard shows useful telemetry information about the ADOT collector itself which can be helpful when you want to troubleshoot any issues with the collector or understand how much resources the collector is consuming.
|
||
|
||
!!!note
|
||
The dashboard and metrics used are not specific to Amazon EKS, but applicable to any environment running an OpenTelemetry collector.
|
||
|
||
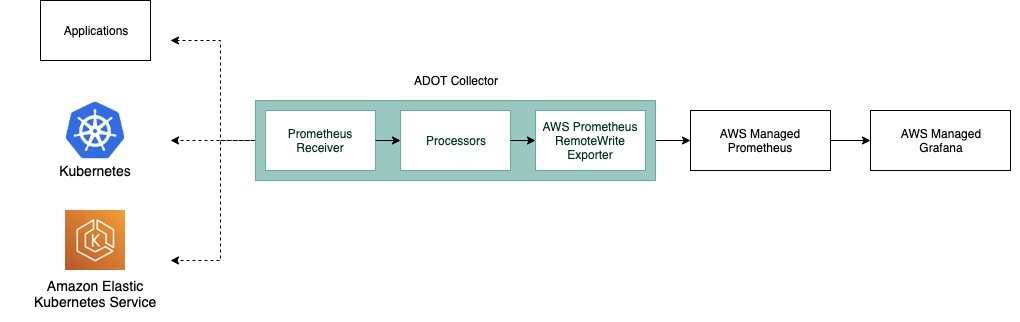
Below diagram shows an example data flow and the components in an ADOT collector:
|
||
|
||
|
||
|
||
|
||
In this dashboard, there are five sections. Each section has [metrics](https://aws-observability.github.io/observability-best-practices/guides/operational/adot-at-scale/operating-adot-collector/#collecting-health-metrics-from-the-collector) relevant to the various [components](https://opentelemetry.io/docs/demo/collector-data-flow-dashboard/#data-flow-overview) of the AWS Distro for OpenTelemetry (ADOT) collector :
|
||
|
||
### Receivers
|
||
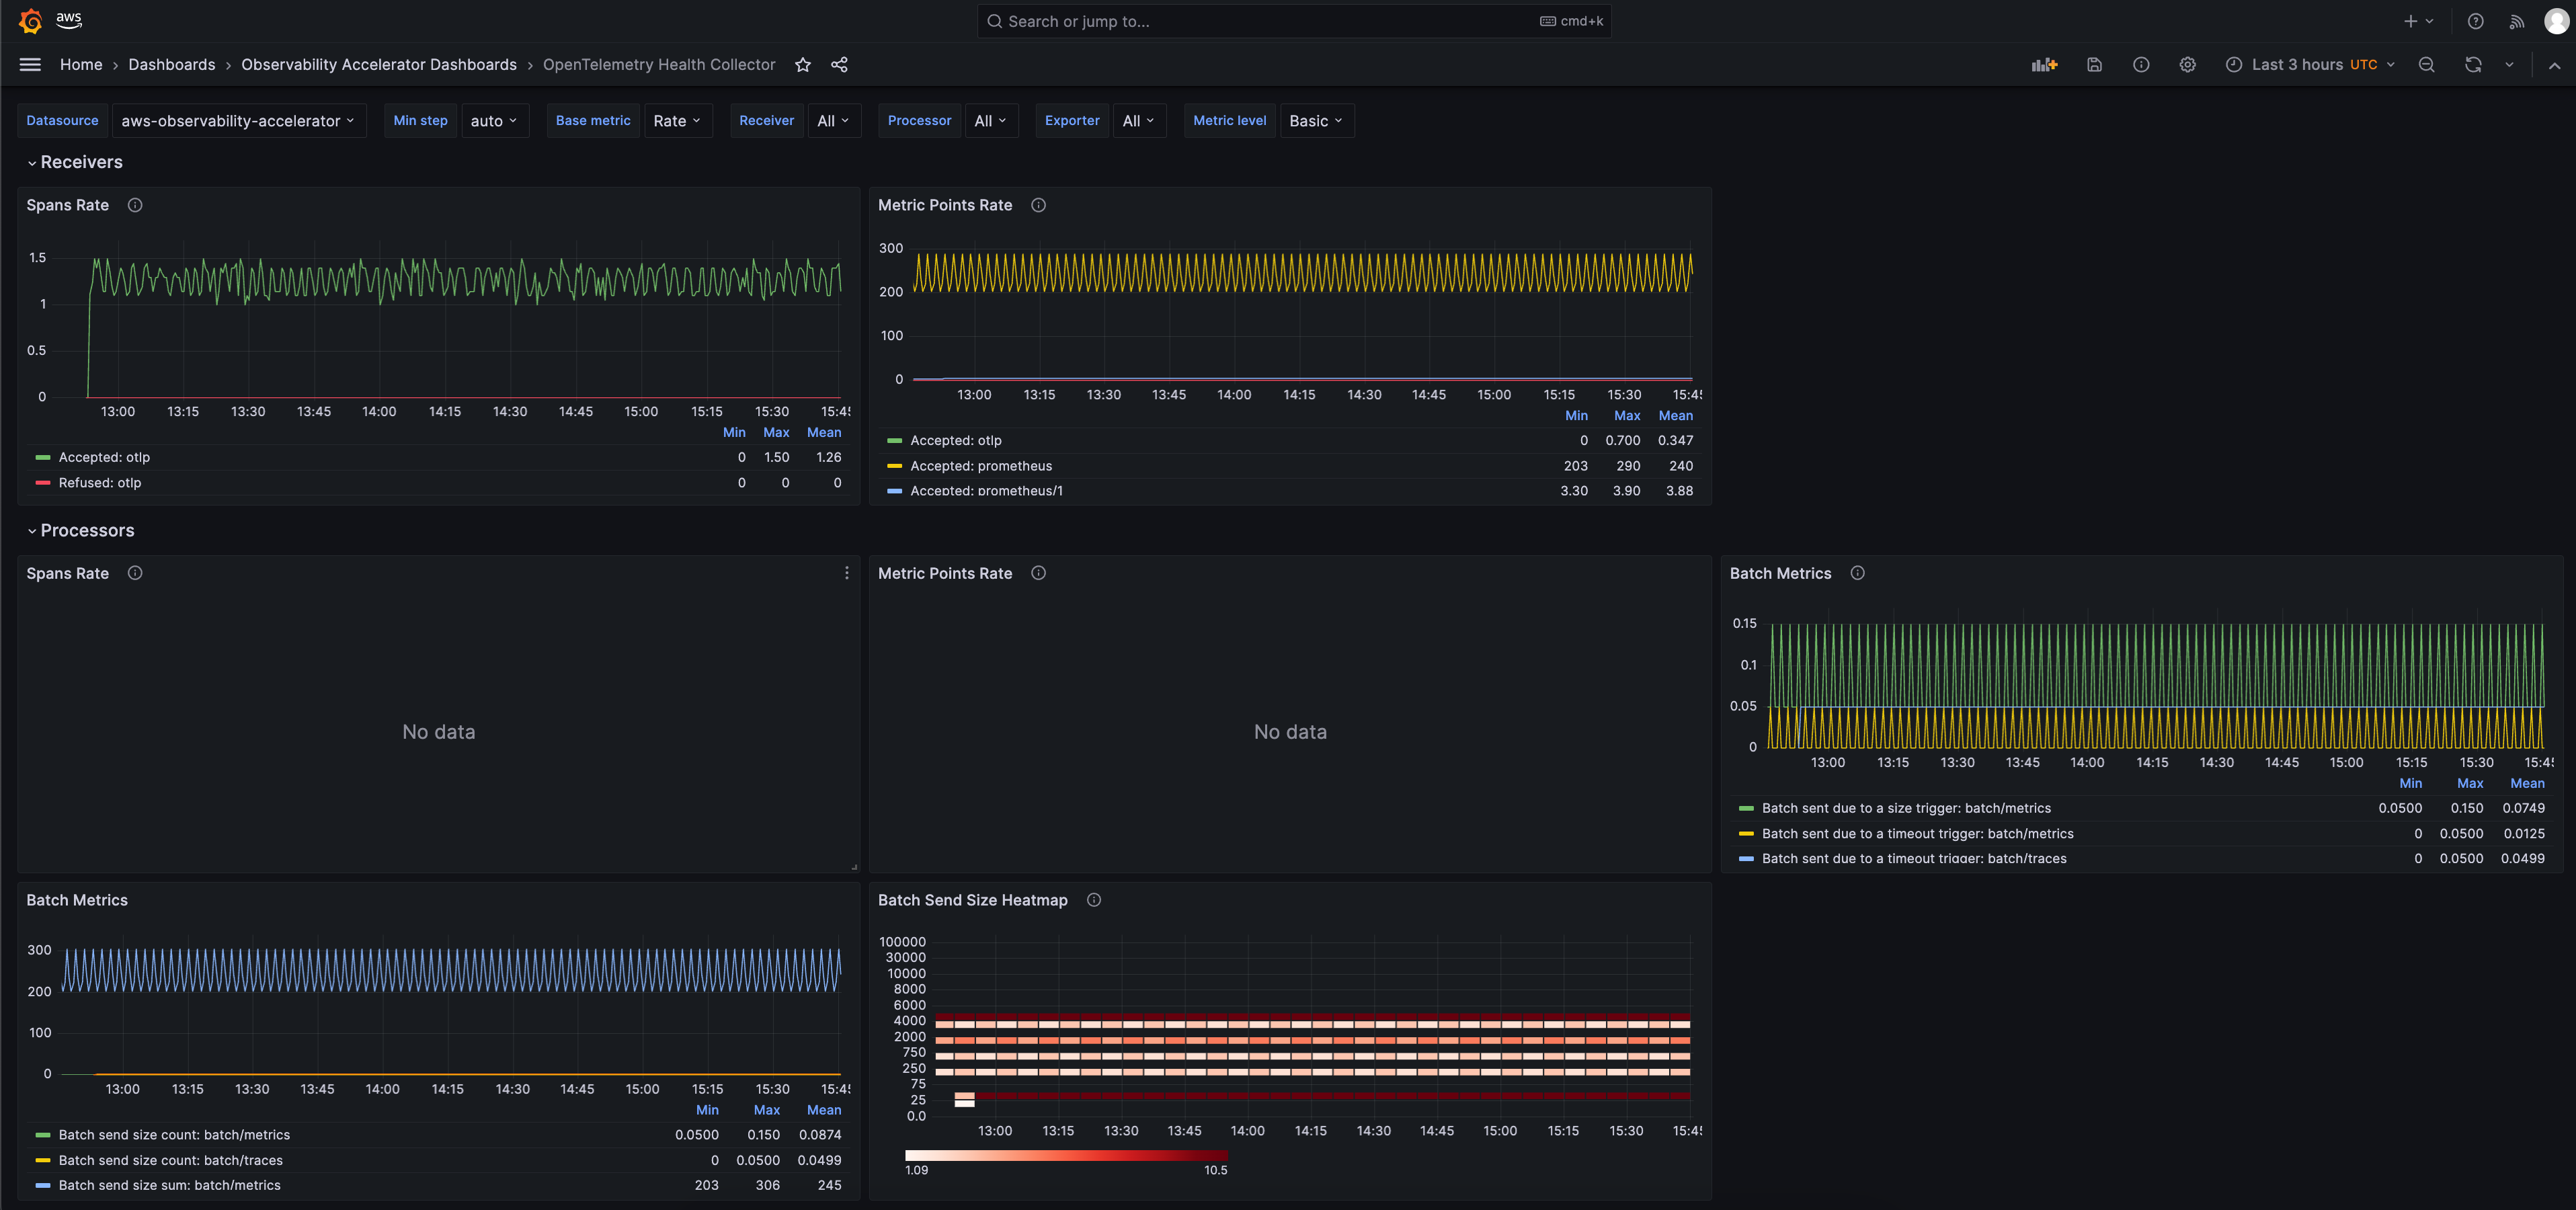
Shows the receiver’s accepted and refused rate/count of spans and metric points that are pushed into the telemetry pipeline.
|
||
|
||
### Processors
|
||
Shows the accepted and refused rate/count of spans and metric points pushed into next component in the pipeline. The batch metrics can help to understand how often metrics are sent to exporter and the batch size.
|
||
|
||
|
||
|
||
|
||
### Exporters
|
||
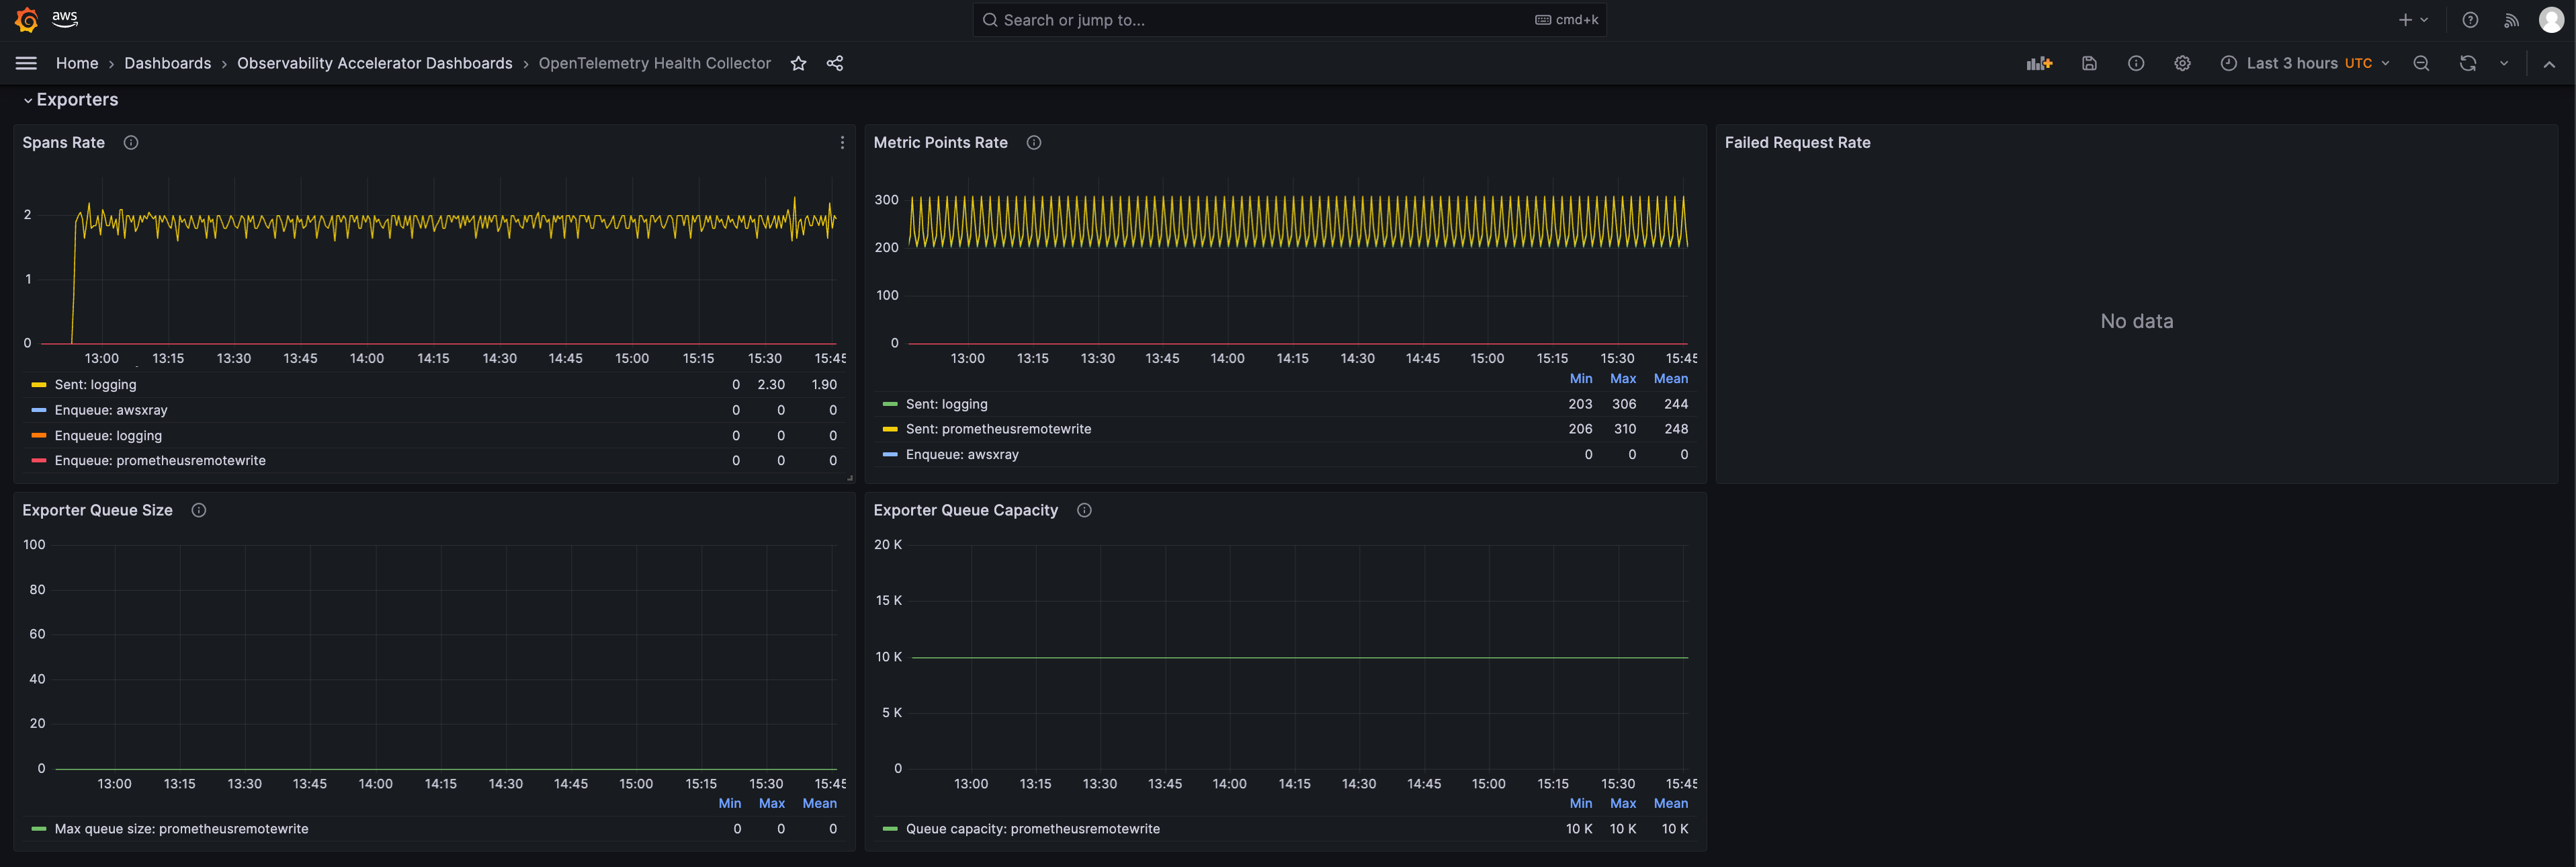
Shows the exporter’s accepted and refused rate/count of spans and metric points that are pushed to any of the destinations. It also shows the size and capacity of the retry queue. These metrics can be used to understand if the collector is having issues in sending trace or metric data to the destination configured.
|
||
|
||
|
||
|
||
|
||
### Collectors
|
||
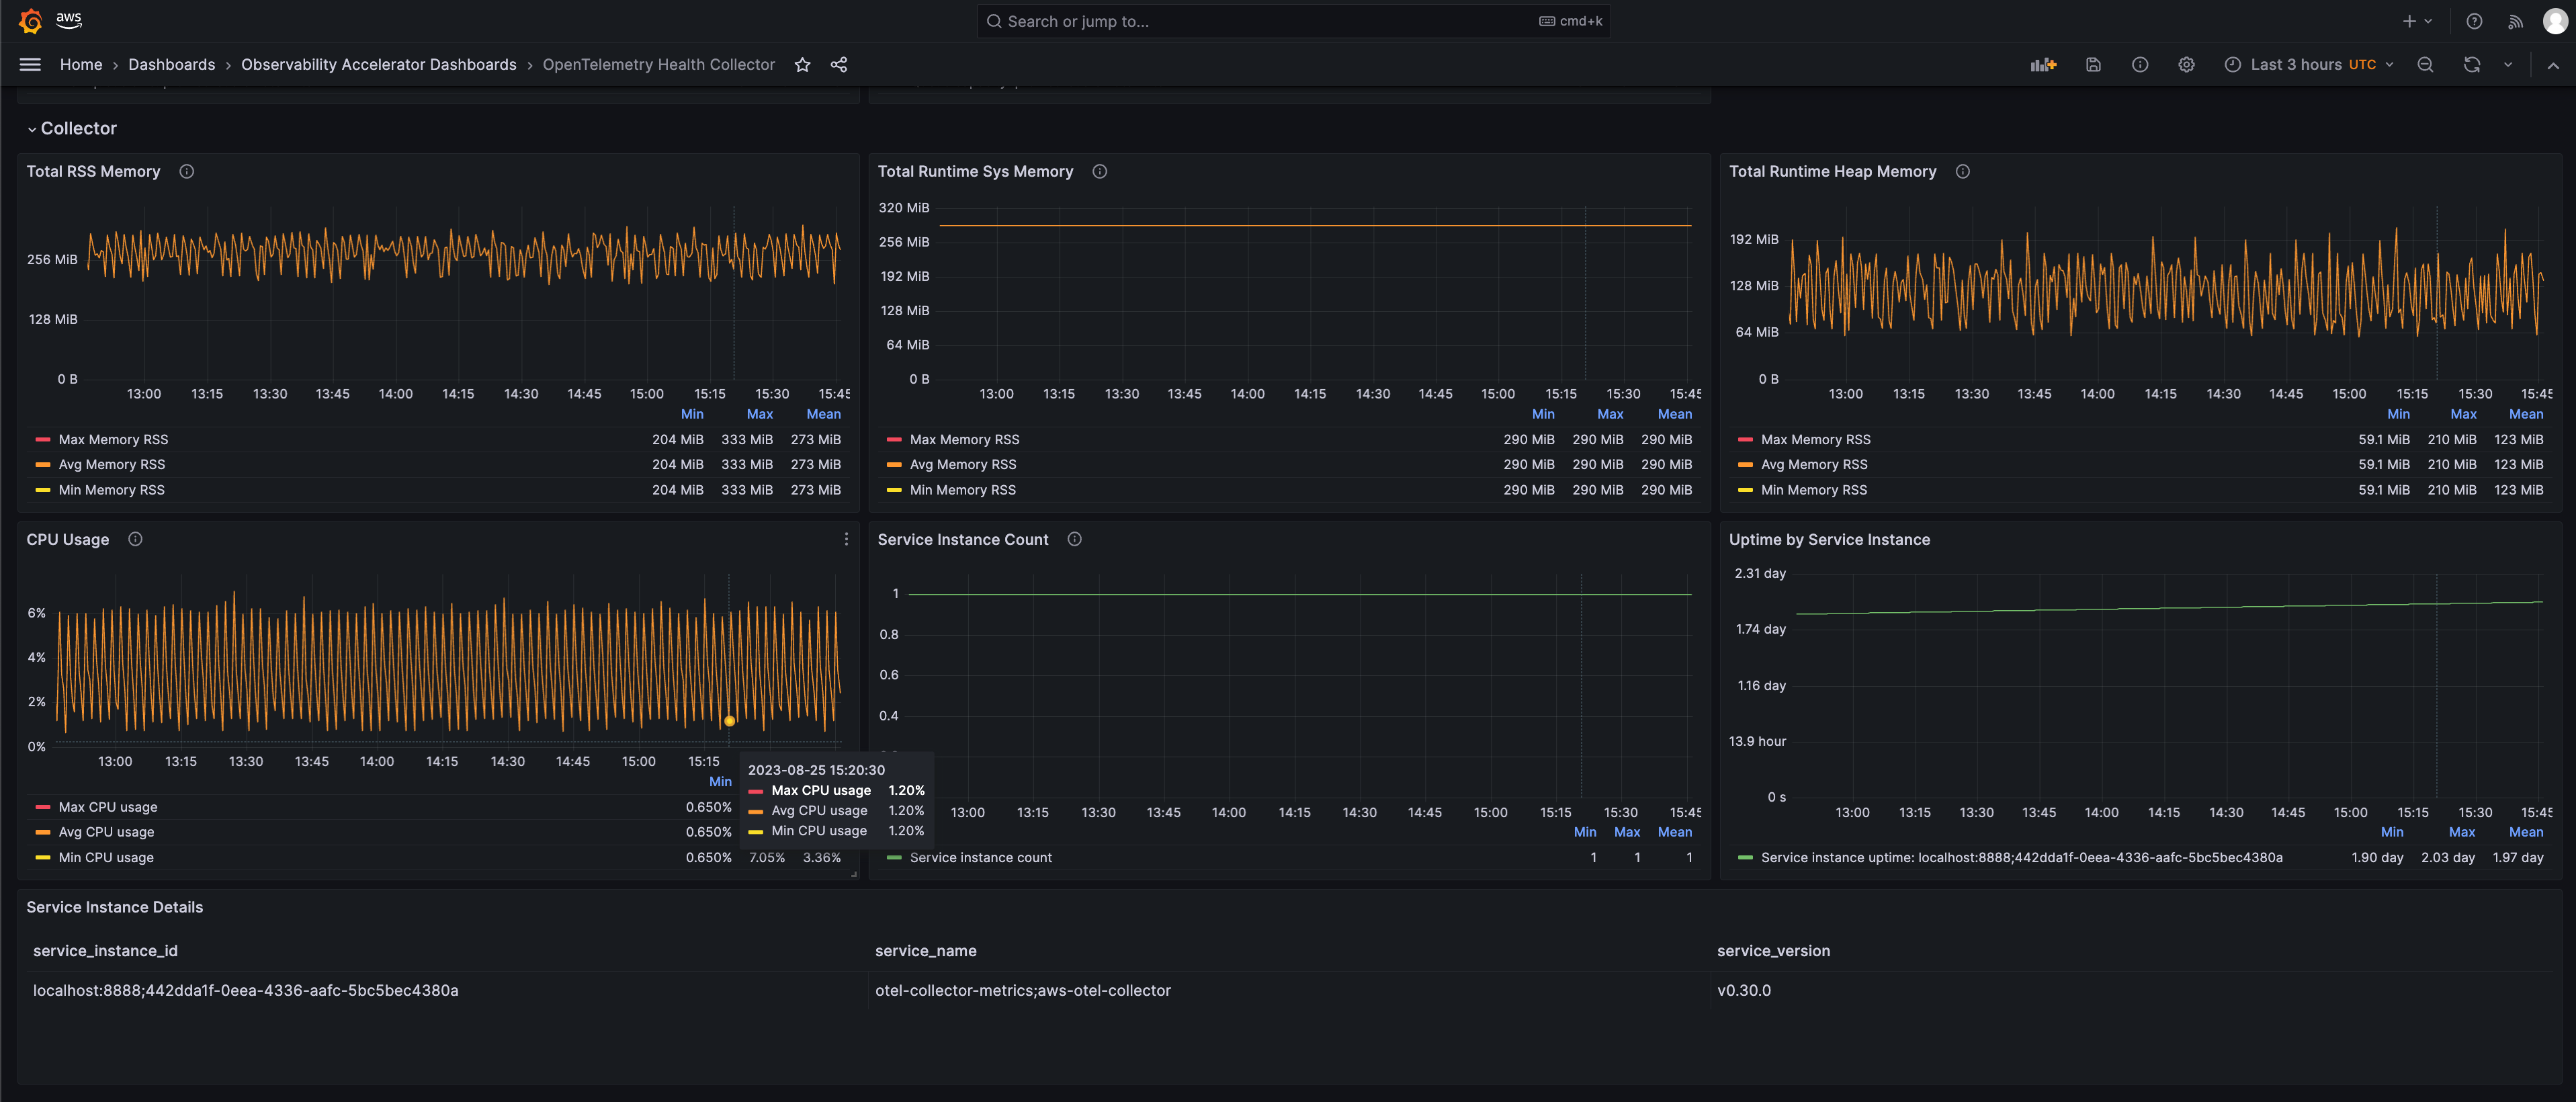
Shows the collector’s operational metrics (Memory, CPU, uptime). This can be used to understand how much resources the collector is consuming.
|
||
|
||
|
||
|
||
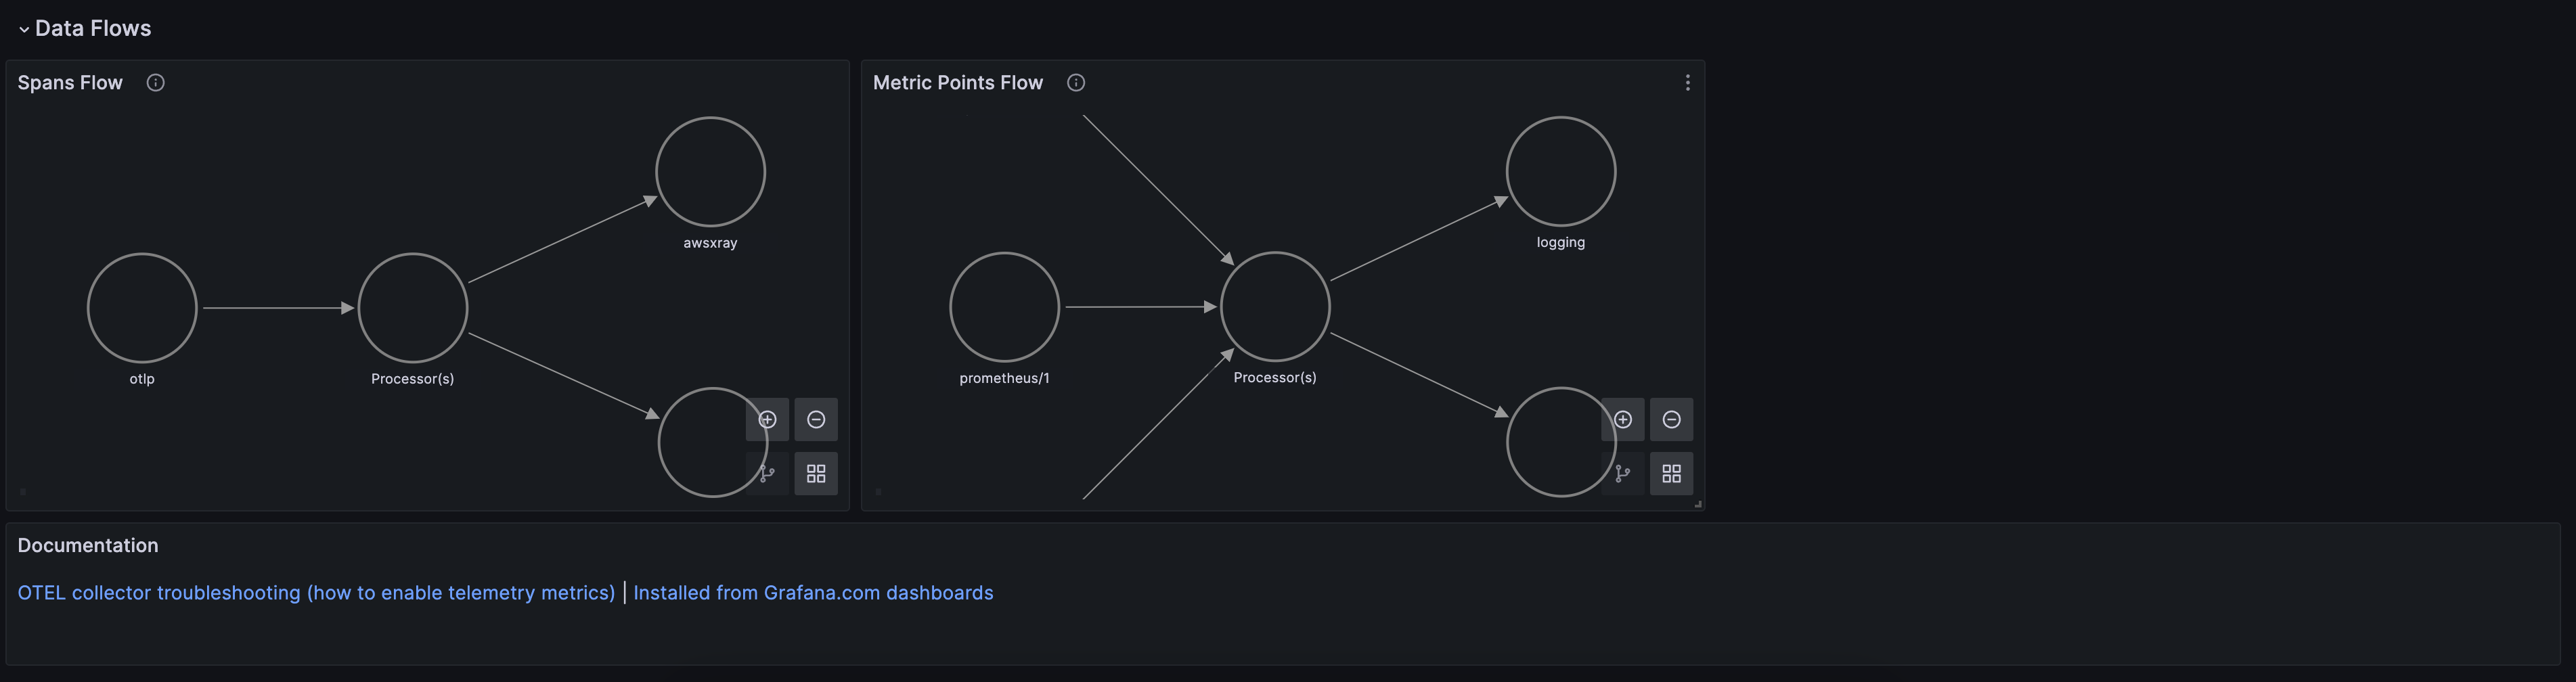
### Data Flow
|
||
Shows the metrics and spans data flow through the collector’s components.
|
||
|
||
|
||
|
||
!!!note
|
||
To read more about the metrics and the dashboard used, visit the upstream documentation [here](https://opentelemetry.io/docs/demo/collector-data-flow-dashboard/).
|
||
|
||
## Deploy instructions
|
||
|
||
As this is enabled by default in the EKS monitoring module, visit [this example’s instructions](https://aws-observability.github.io/terraform-aws-observability-accelerator/eks/#prerequisites) which will provide the ADOT collector health dashboard after deployment
|
||
|
||
## Disable ADOT health monitoring
|
||
|
||
You can disable ADOT collector health metrics by setting the [variable](https://github.com/aws-observability/terraform-aws-observability-accelerator/blob/main/modules/eks-monitoring/variables.tf) enable_adotcollector_metrics to false.
|
||
|
||
```
|
||
variable "enable_adotcollector_metrics" {
|
||
description = "Enables collection of ADOT collector metrics"
|
||
type = bool
|
||
default = true
|
||
}
|
||
```
|