mirror of
https://github.com/storytold/terraform-aws-observability-accelerator.git
synced 2026-10-09 00:09:43 +00:00
 Rodrigue Koffi
fa38a90efc
Rodrigue Koffi
fa38a90efc
* Typo

* Remove Grafana provider

* Temp: move dashbaords to gitOps

* Move external labels to resource attributes

* Avoid DDoS with using 0.0.0.0

* Pre-commit

* Transition in two steps

Will need to remove provider in a separate version to provide a transition path as removing this will break terraform and leave orphans in the state

* Move patterns' dashboards creation to gitOps

Standardize config objects for patterns as well

* Pre-commit

* Create AMP dashboard from external source with Grafana provider

* Fix deprecated option

* Fix Flux requirements

* Run pre-commit

* Update example with operator

* Cleanup examples

* Update multicluster example

* Update multicluster example

* Drop dead variable

* Update docs

* Change GitOps branch name

* Update docs

* Replacing Secrets Manager to SSM to store Grafana API Key (#178)

* Fixing SSM

* Fixing SSM

* Replacing Secrets Manager with SSM

* Replacing Secrets Manager with SSM

* Update architecture diagram

* Update architecture diagram

* Update README.md

* Update index.md

* Fixing Grafana Operator Version

* Fix multicluster example

* Update docs

---------

Co-authored-by: Ela AWS <51791117+elamaran11@users.noreply.github.com>
Co-authored-by: Elamaran Shanmugam <elamaran.shan@gmail.com>
64 lines
3.2 KiB
Markdown
64 lines
3.2 KiB
Markdown
# AWS Observability Accelerator for Terraform
|
|
|
|
Welcome to the AWS Observability Accelerator for Terraform!
|
|
|
|
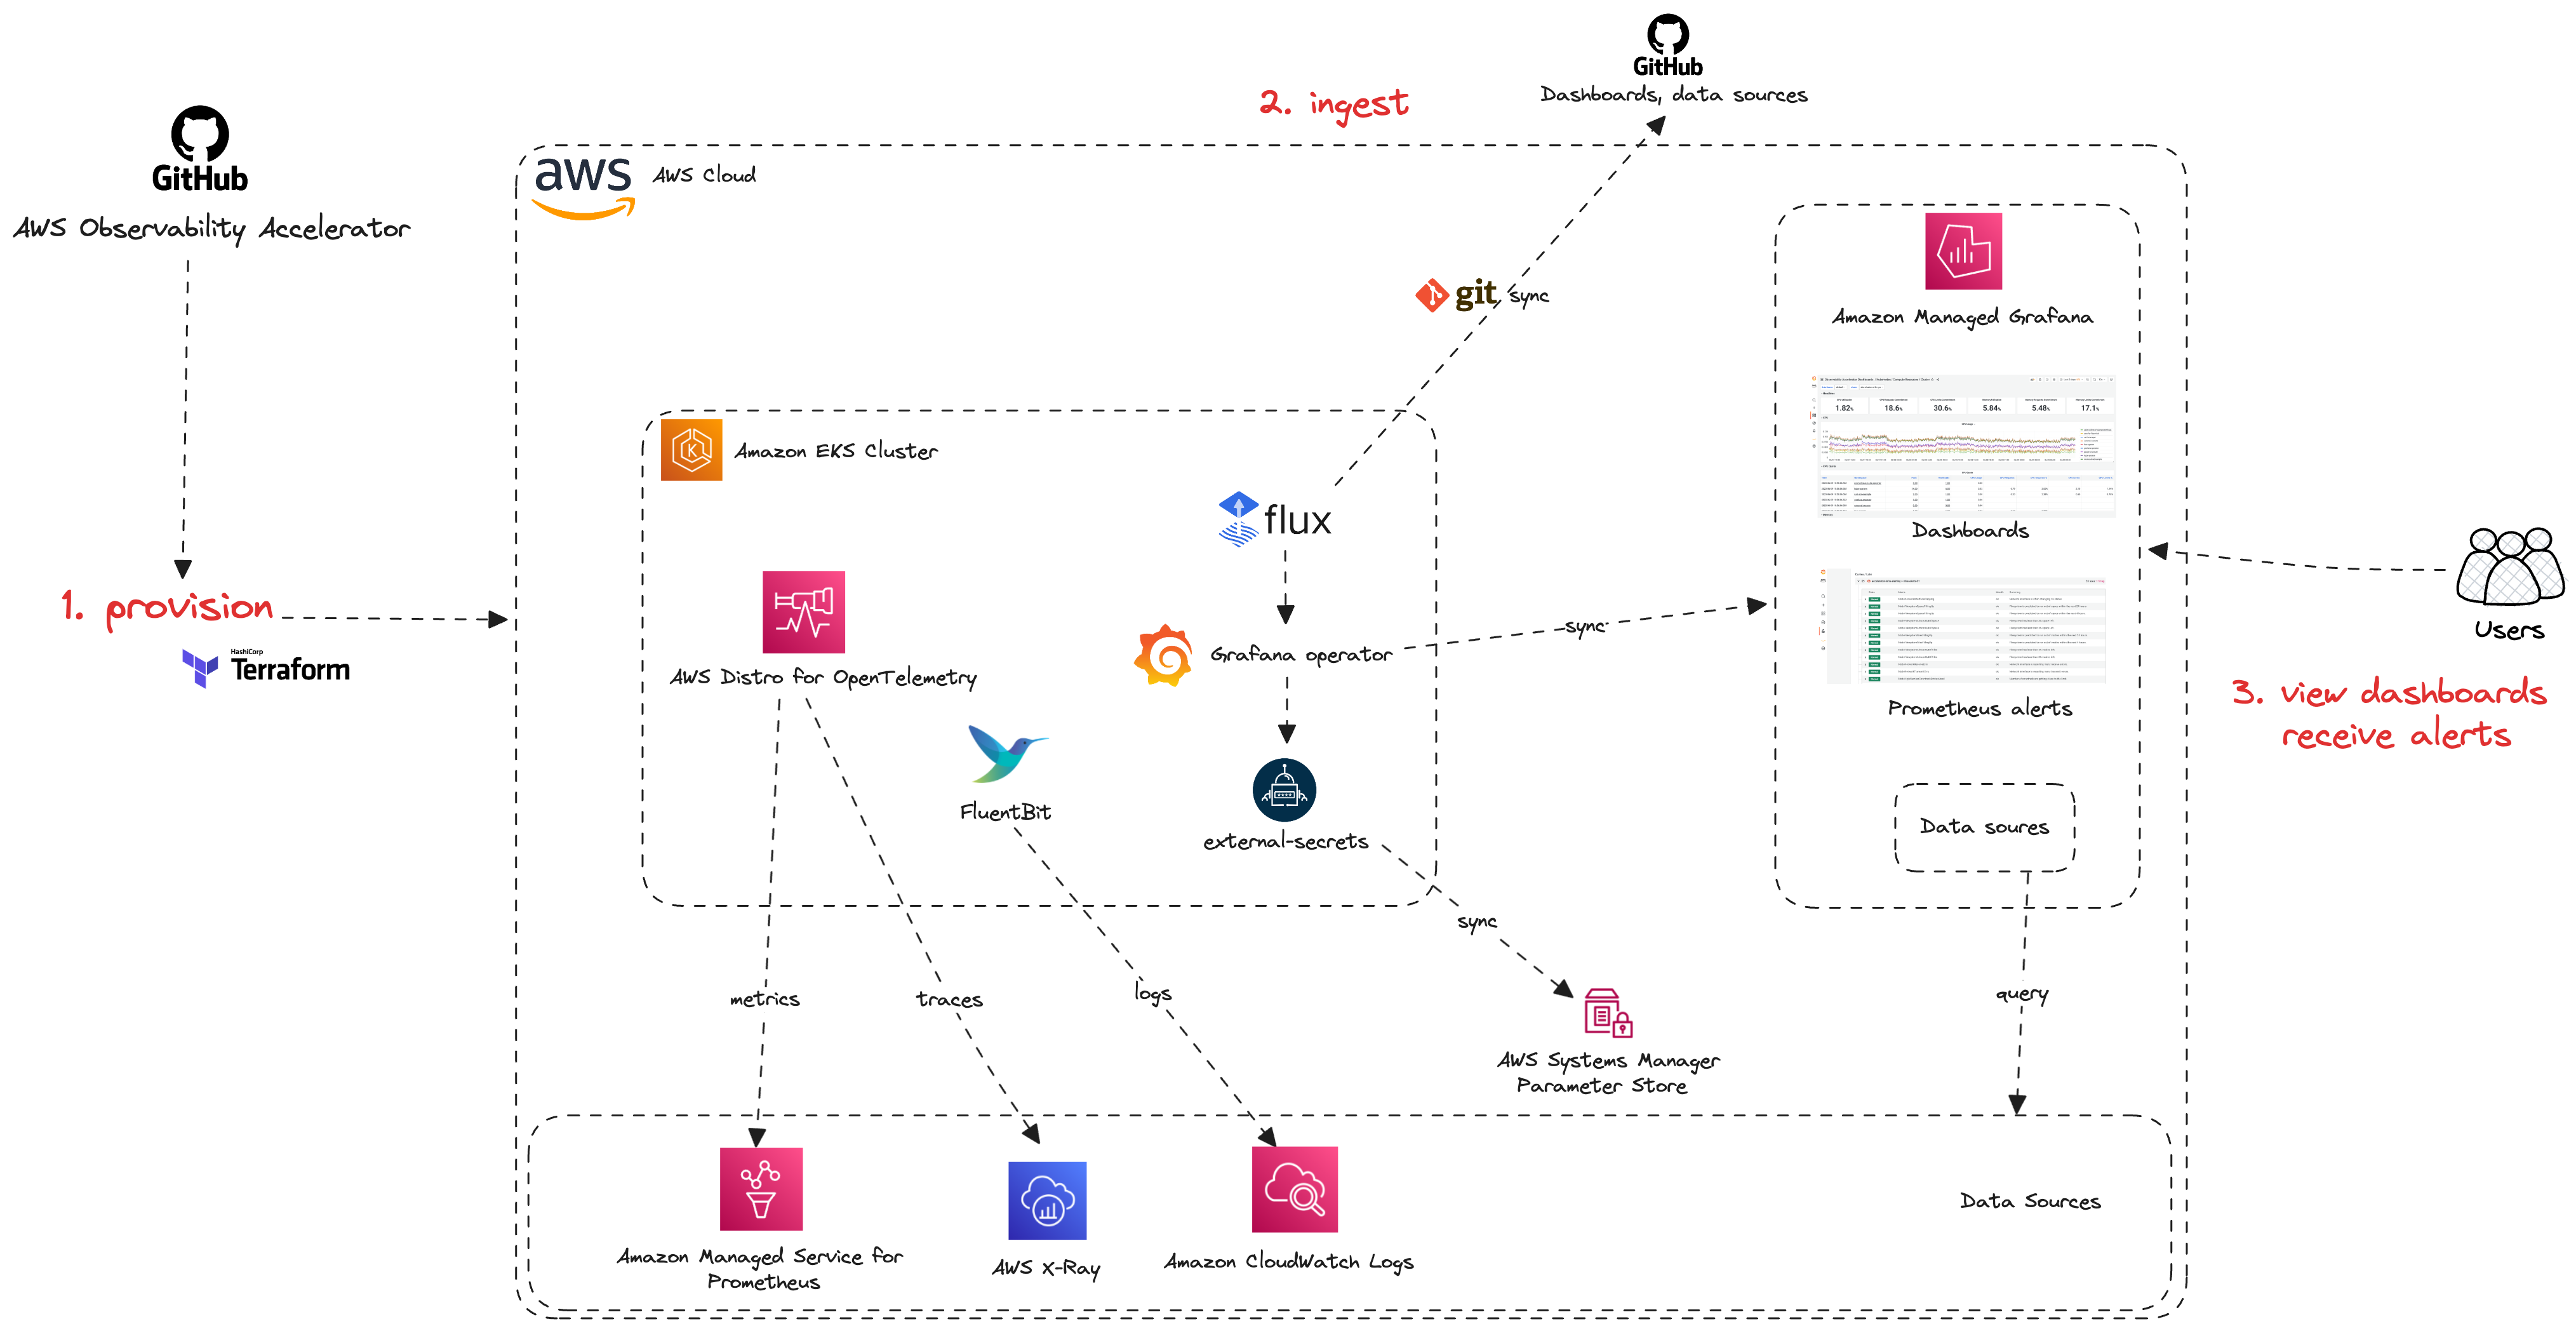
The AWS Observability Accelerator for Terraform is a set of opinionated modules to
|
|
help you set up observability for your AWS environments with
|
|
AWS-managed observability services such as Amazon Managed Service for Prometheus,
|
|
Amazon Managed Grafana, AWS Distro for OpenTelemetry (ADOT) and Amazon CloudWatch.
|
|
|
|
We provide curated metrics, logs, traces collection, alerting rules and Grafana
|
|
dashboards for your EKS infrastructure, Java/JMX, NGINX based workloads and
|
|
your custom applications.
|
|
|
|
You also can monitor your Amazon Managed Service for Prometheus workspaces ingestion,
|
|
costs, active series with [this module](https://aws-observability.github.io/terraform-aws-observability-accelerator/workloads/managed-prometheus/).
|
|
|
|
|
|
|
|
## Getting started
|
|
|
|
This project provides a set of Terraform modules to enable metrics, logs and
|
|
traces collection, dashboards and alerts for monitoring:
|
|
|
|
- Amazon EKS clusters infrastructure and applications
|
|
- NGINX workloads (running on Amazon EKS)
|
|
- Java/JMX workloads (running on Amazon EKS)
|
|
- Amazon Managed Service for Prometheus workspaces with Amazon CloudWatch
|
|
- [Grafana Operator](https://github.com/grafana-operator/grafana-operator) and [Flux CD](https://fluxcd.io/) to manage Grafana contents (AWS data sources, Grafana Dashboards) with GitOps
|
|
- External Secrets Operator to retrieve and sync the Grafana API keys
|
|
|
|
These modules can be directly configured in your existing Terraform
|
|
configurations or ready to be deployed in our packaged
|
|
[examples](https://github.com/aws-observability/terraform-aws-observability-accelerator/tree/main/examples)
|
|
|
|
!!! tip
|
|
We have supporting examples for quick setup such as:
|
|
|
|
- Creating a new Amazon EKS cluster and a VPC
|
|
- Creating and configure an Amazon Managed Grafana workspace with SSO
|
|
|
|
## Motivation
|
|
|
|
To gain deep visibility into your workloads and environments, AWS proposes a
|
|
set of secure, scalable, highly available, production-grade managed open
|
|
source services such as Amazon Managed Service for Prometheus, Amazon Managed
|
|
Grafana and Amazon OpenSearch.
|
|
|
|
AWS customers have asked for best-practices and guidance to collect metrics, logs
|
|
and traces from their containerized applications and microservices with ease of
|
|
deployment. Customers can use the AWS Observability Accelerator to configure their
|
|
metrics and traces collection, leveraging [AWS Distro for OpenTelemetry](https://aws-otel.github.io/),
|
|
to have opinionated dashboards and alerts available in only minutes.
|
|
|
|
|
|
## Support & Feedback
|
|
|
|
AWS Observability Accelerator for Terraform is maintained by AWS Solution Architects.
|
|
It is not part of an AWS service and support is provided best-effort by the
|
|
AWS Observability Accelerator community.
|
|
|
|
To post feedback, submit feature ideas, or report bugs, please use the [issues](https://github.com/aws-observability/terraform-aws-observability-accelerator/issues) section of this GitHub repo.
|
|
|
|
If you are interested in contributing, see the [contribution guide](https://github.com/aws-observability/terraform-aws-observability-accelerator/blob/main/CONTRIBUTING.md).
|