mirror of
https://github.com/storytold/terraform-aws-observability-accelerator.git
synced 2026-10-09 00:09:43 +00:00
 Ruchika Modi
70405b9732
Ruchika Modi
70405b9732
* Adding Module and Example for ECS cluster monitoring with ecs_observer

* Adding Module and Example for ECS cluster monitoring with ecs_observer

* Incorporating PR comments

* Restructuring Examples and modules folder for ECS, Added content in main Readme

* Fixing path as per PR comments

* Parameterzing the config files, incorporated PR review comments

* Adding condition for AMP WS and fixing AMP endpoint

* Adding Document for ECS Monitoring and parameterized some variables

* Added sample dashboard

* Adding Document for ECS Monitoring and parameterized some variables

* Fixing failures detected by pre-commit

* Fixing failures detected by pre-commit

* Fixing failures detected by pre-commit

* Pre-commit fixes

* Fixing failures detected by pre-commit

* Fixing failures detected by pre-commit

* Pre-commit

* Fixing HIGH security alerts detected by pre-commit

* Fixing HIGH security alerts detected by pre-commit

* Fixing HIGH security alerts detected by pre-commit, 31stOct

* Add links after merge

* 2ndNov - Added condiotnal creation for Grafana WS and module versions for AMG, AMP

---------

Co-authored-by: Rodrigue Koffi <bonclay7@users.noreply.github.com>
63 lines
2.4 KiB
Markdown
63 lines
2.4 KiB
Markdown
# Amazon ECS on EC2 cluster monitoring
|
|
|
|
This example demonstrates how to monitor your Amazon Elastic Container Service on EC2
|
|
(Amazon ECS) cluster with the Observability Accelerator's ECS monitoring module
|
|
|
|
The module collects Prometheus metrics from tasks running on ECS and sends it to Prometheus using AWS Distro for OpenTelemetry Collector (ADOT).
|
|
You can either run the collector as a sidecar or deploy the collector as its own ECS service for entire cluster.
|
|
ECS tasks with Prometheus endpoints are discovered using extension
|
|
[ecsobserver](https://github.com/open-telemetry/opentelemetry-collector-contrib/blob/main/extension/observer/ecsobserver/README.md).
|
|
(Unlike EKS, there is no builtin discovery for ECS inside prometheus)
|
|
|
|
Additionally, you can optionally collect custom Prometheus metrics from your applications running
|
|
on your ECS cluster.
|
|
|
|
## Prerequisites
|
|
|
|
!!! note
|
|
Make sure to complete the [prerequisites section](https://aws-observability.github.io/terraform-aws-observability-accelerator/concepts/#prerequisites) before proceeding.
|
|
|
|
## Available Samples for various Worklods
|
|
Make sure to update your exisitng Application Task Definitions based on the workload type :-
|
|
|
|
#### 1. [Java/JMX workload for ECS Clusters](https://docs.aws.amazon.com/AmazonCloudWatch/latest/monitoring/ContainerInsights-Prometheus-Sample-Workloads-ECS-javajmx.html)
|
|
#### 2. [NGINX workload for Amazon ECS clusters](https://docs.aws.amazon.com/AmazonCloudWatch/latest/monitoring/ContainerInsights-Prometheus-Setup-nginx-ecs.html)
|
|
#### 3. [App Mesh workload](https://docs.aws.amazon.com/AmazonCloudWatch/latest/monitoring/ContainerInsights-Prometheus-Sample-Workloads-ECS-appmesh.html)
|
|
|
|
## Setup
|
|
|
|
#### 1. Add the ECS Monitoring Module to your exisitng ECS CLuster
|
|
|
|
```
|
|
module "ecs_monitoring" {
|
|
source = "../../modules/ecs-monitoring"
|
|
aws_ecs_cluster_name = module.ecs_cluster.cluster_name
|
|
task_role_arn = module.ecs_cluster.task_exec_iam_role_arn
|
|
execution_role_arn = module.ecs_cluster.task_exec_iam_role_arn
|
|
|
|
depends_on = [
|
|
module.ecs_cluster
|
|
]
|
|
}
|
|
```
|
|
|
|
## Deploy
|
|
|
|
Simply run this command to deploy the example
|
|
|
|
```bash
|
|
terraform apply
|
|
```
|
|
|
|
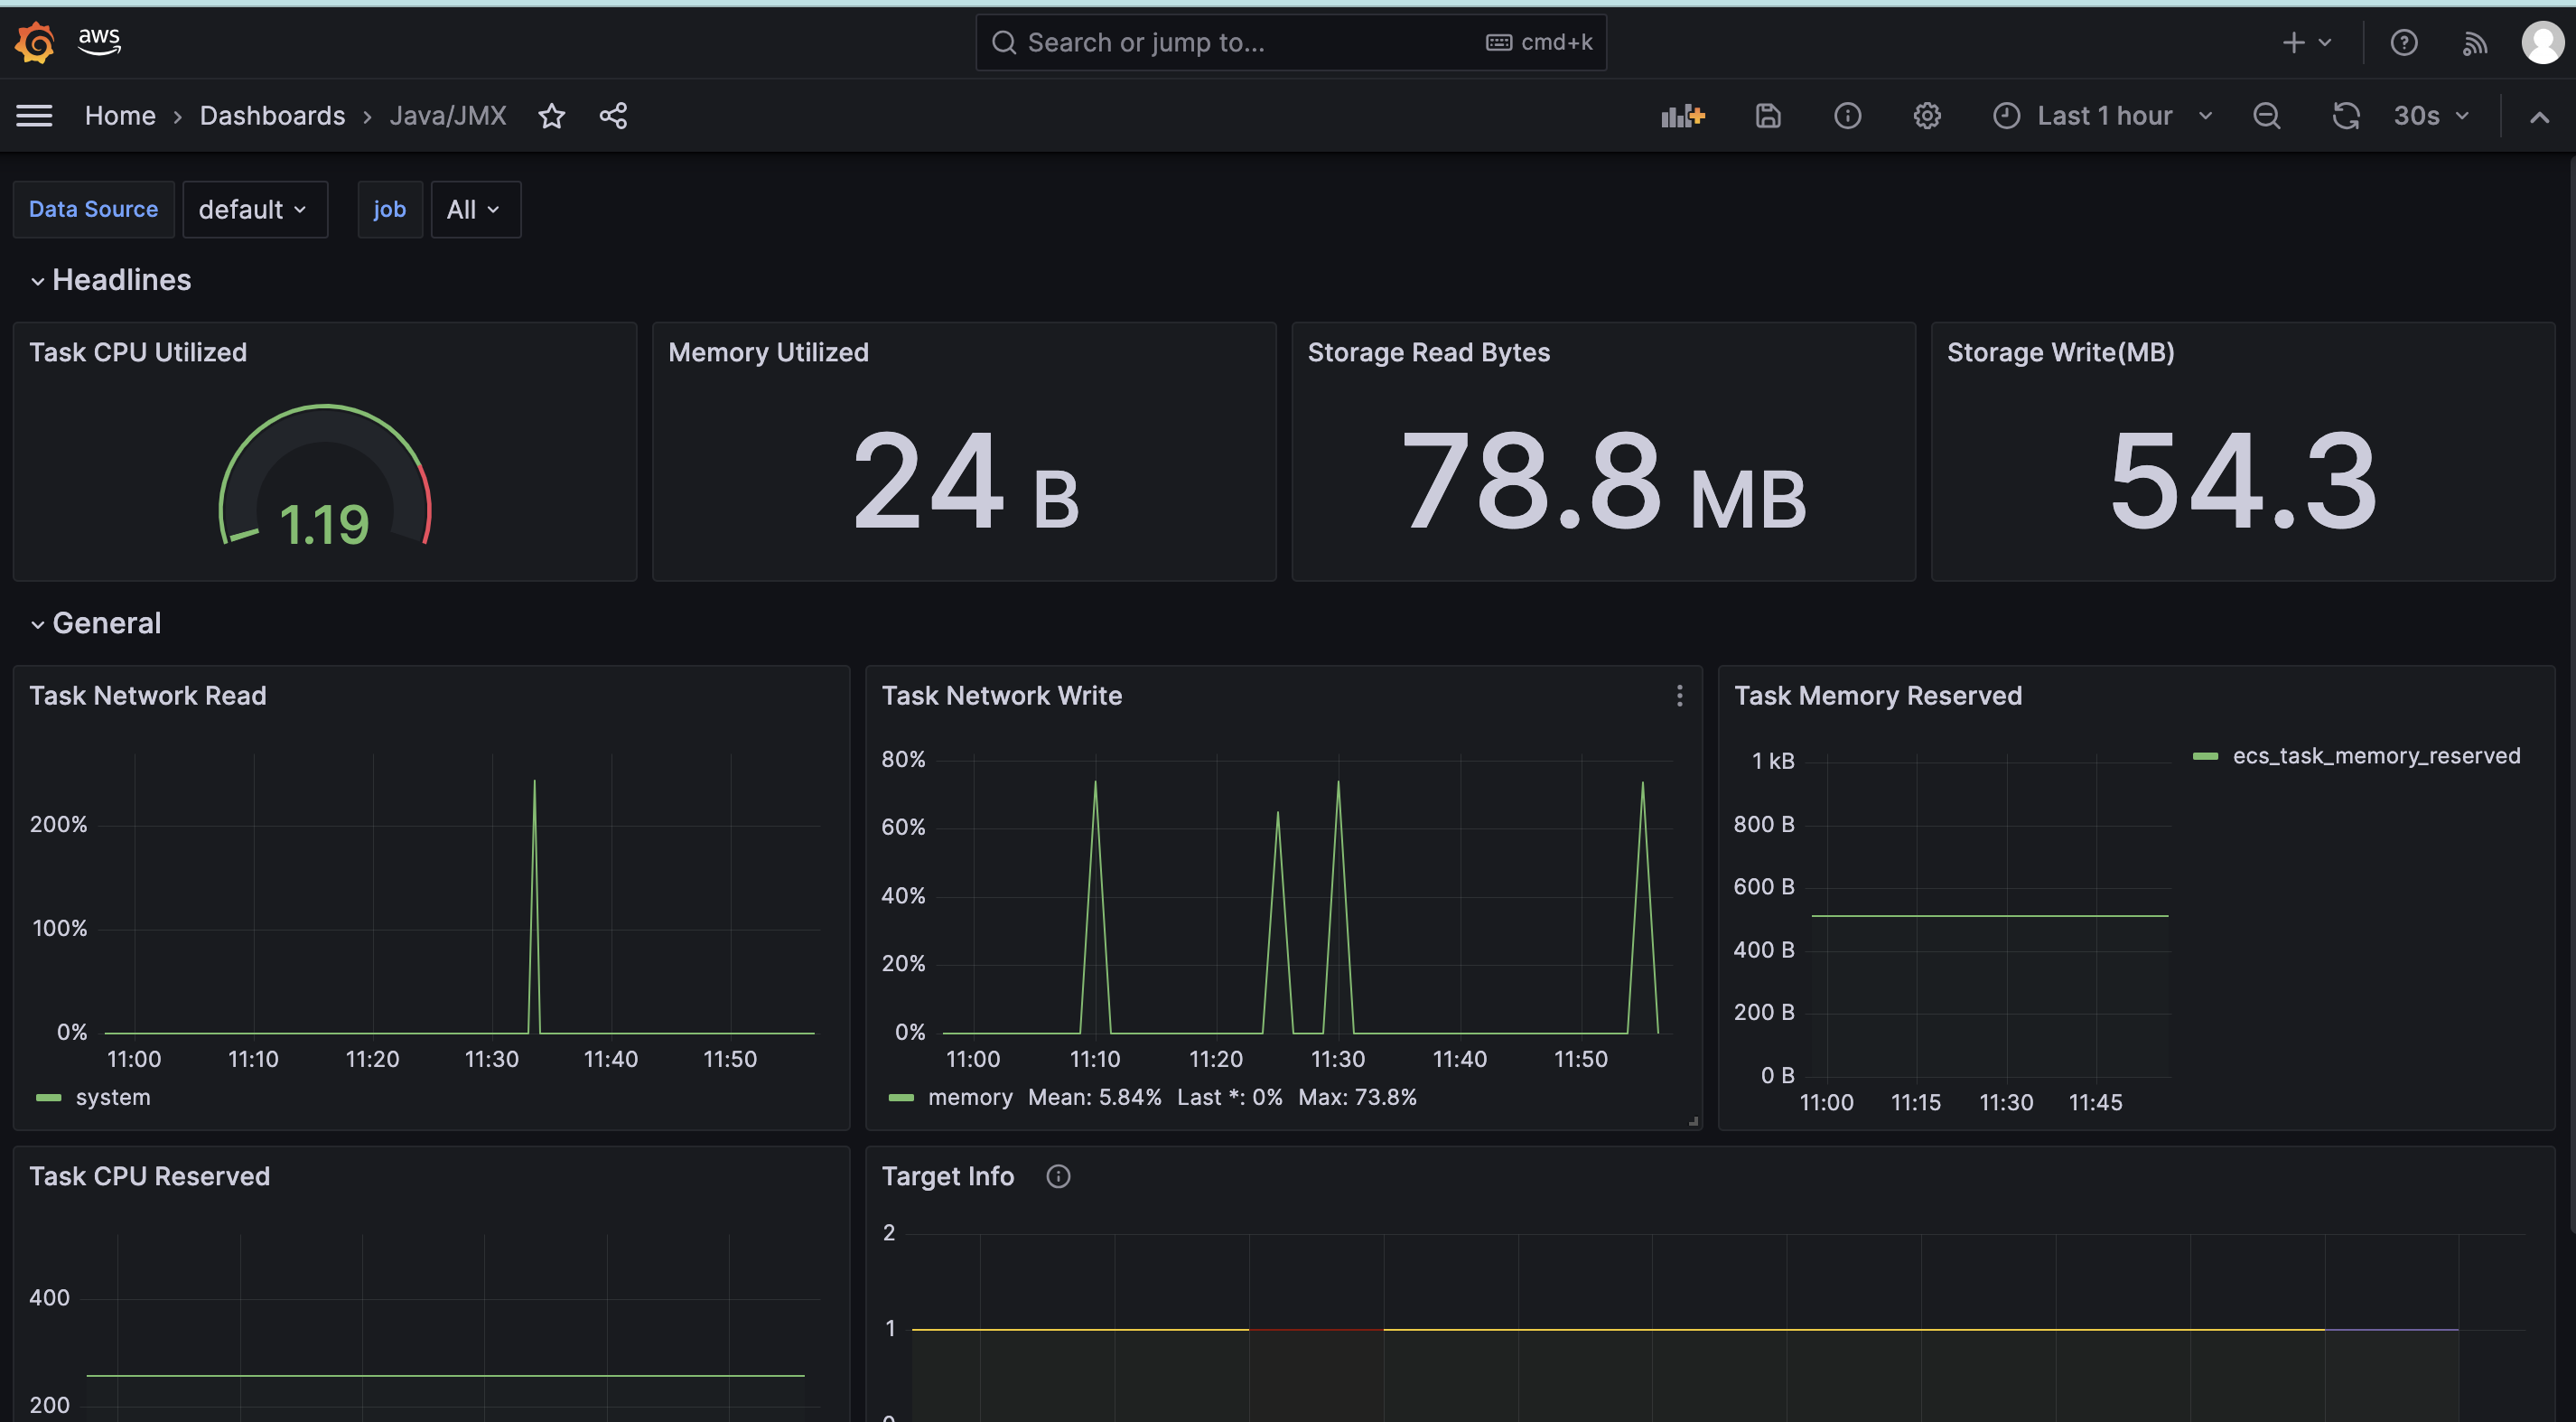
## Visualization
|
|
|
|
|
|
|
|
## Cleanup
|
|
|
|
To clean up your environment, destroy the Terraform example by running
|
|
|
|
```sh
|
|
terraform destroy
|
|
```
|